Dashboards were created to give administrators access to a series of visualizations that, through indices declined at the municipal and sub-municipal level, provide keys to understanding the urban reality and enable analysis to support decision making.
The basis of the dashboards is the integration of different sources and different datasets, which, when correlated, give rise to the indicators that address different themes and issues.
The data used to construct the indices are all Open Data in the Thematic Dashboards that are based, for example, on satellite data reprocessed and correlated with ISTAT, ISPRA, or data published by other institutions.
What are the City Dashboards
City Dashboards are visualizations of indicators built not only from Open Data sources, but integrated with data sources that belong specifically to the administration that equips itself with the tool. Municipal registry, mobility data, and green data can, that is, be reprocessed and related to each other so d create dashboards displaying indicators that, distributed at the sub-municipal level, give insight into the different characteristics of the administered territory and the community that lives in it in a more punctual and specific way.
City Dashboards are related to the following themes:
- Welfare
- Urban green space
- Urban planning and mobility
- Economy
Welfare
The Dashboard is a key tool that allows administrators to analyze data on the resident population and continuously monitor the dynamics of the social fabric that makes up the city. The composition of residents is represented spatially to give insight into the different characteristics of residents in different parts of the city.
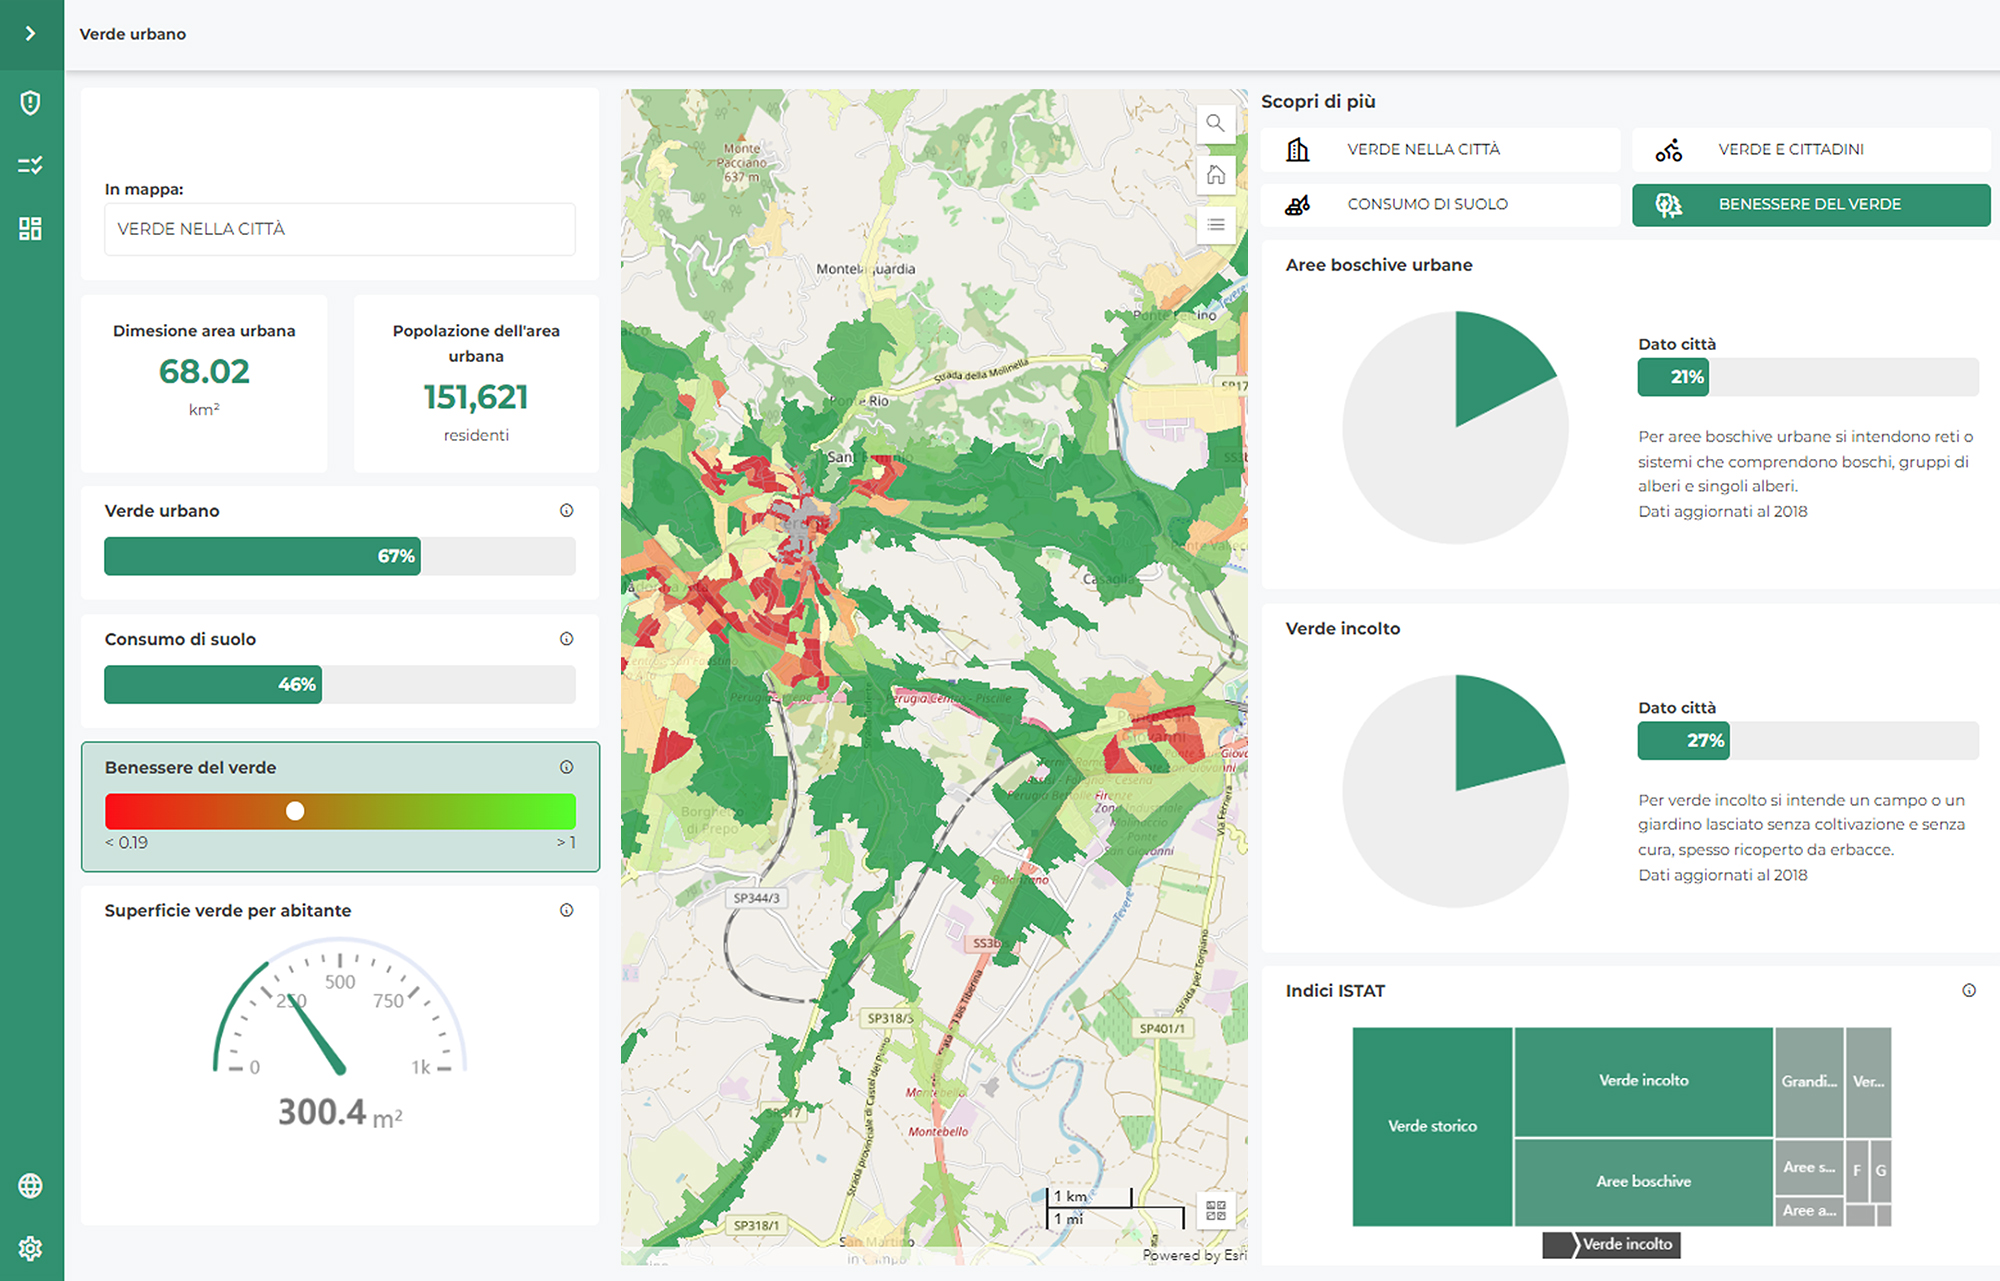
Urban green space
The creation of green cities is a priority goal, and the City Dashboard of urban greening is an advanced tool that succeeds in taking full advantage of the potential of open data and satellite observation.
These data correlated with data on residents or supplemented with additional details on public green space give administrators visibility into the state of urban green space at the sub-municipal level so as to support and inform the maintenance process and guide strategic and planning choices.
Urban planning
How the built-up area develops, how fragmented it is, how population density varies between neighborhoods, how property values evolve in buying and selling and renting. The Dashboard attempts to answer these questions by considering Istat, ISPRA, Internal Revenue Service and satellite data. Integration with data from internal mobility within the municipality, parking lots and sensors distributed throughout the municipality give possibilities for even more elaborate and specific dashboards capable of showing in detail the characteristics of internal mobility.
Economy
Employment, unemployment, distribution of the business fabric. The Dashboard helps administrators interpret the evolution of the city’s economic fabric. The Income category then, with data on employees, the self-employed, and retirees can allow us to understand how different segments of the population are getting richer or poorer with all the consequences for municipal policies. From this open data, the dashboard can be integrated with any other source of economic data that the municipality can make available to analyze specific dynamics of its interest.
Regardless of the theme addressed by the dashboard, the creation process is always the same:
- Identification of the city dashboard and municipal data sources to be integrated for the construction of the indices of interest,
- Integration and processing of data for index construction,
- Possible integration with open data sources,
- city dashboard production and their visualization for informed and timely decision making.
Wiseland uses a platform for the creation of all different types of City Dashboard.
Wiseland is the first Italian business network for the Digital Twin and is founded by Geolander.it and WiseTown.
